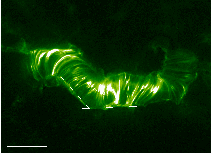
We're just doing a further discussion of this year's Bastille Day flare. As the image below illustrates, the two "ribbons" of this flare were extremely sharply defined, slicing clean regular lines into the complicated magnetic structure of the active region:

The thin lines on this plot just guide the eye to the astonishingly simple patterns along the SW and S ribbon, as seen by TRACE. The bar at lower left is one arc min (about 43,000 km), roughly the size of the "supergranulation" that is largest recognized spatial scale in the solar photosphere (and hence the largest recognized scale of the photospheric magnetic field).
Our plan for this science nugget is to explore the behavior of the flare ribbons as they develop so beautifully in this event, and to compare them with the solar magnetic field that governs the physics. The "ribbons" are roughly-parallel advancing fronts of excitation in the chromosphere, and represent the footpoints of the hot coronal loops that you can see in the image above, for example. The flare arcade is beautifully cylindrical in its basic structure, but the chromosphere is fluffy and disorganized. How can a higgledy-piggledy photospheric field accommodate to a serene and regular coronal field?
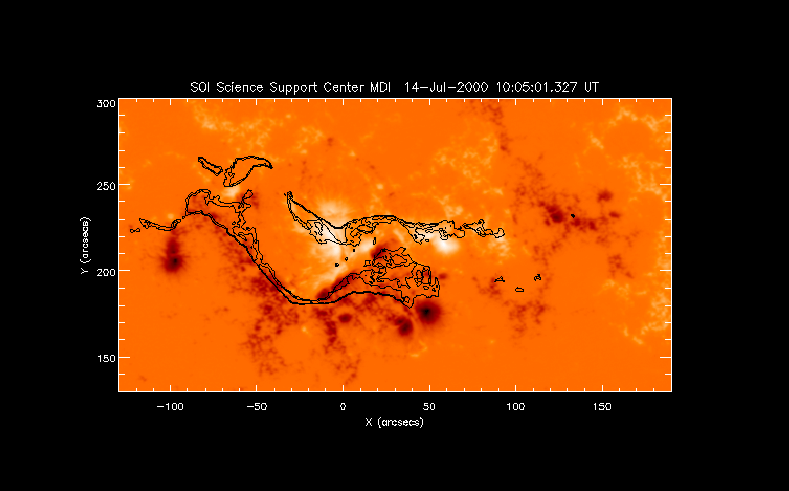
First of all, a sanity check. Do the two ribbons fall neatly into opposite field polarities? We can find out by comparing the TRACE ribbon locations with the line-of-sight magnetograms recorded on SOHO by the MDI instrument, which can measure the Zeeman splitting and hence determine the component of the field along the line of sight. Because this flare is near disk center, the line-of-sight component is nearly the vertical component, making for a clean interpretation.

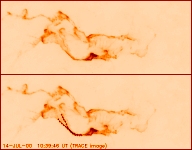
No problem, sure enough the two ribbons mainly lie in opposite colors (opposite polarities). Compare this with the chromospheric overlay we showed above, for a different perspective. To show the motion of the ribbons, a movie would be good, but here's a simpler view:

The image at the bottom shows points sketching out the ribbon locations (in that vicinity) for the image at the time shown, and one 16 minutes earlier. We are somewhat astonished to see that the later image (shown) contains traces of the initial ribbon location as well as the current one! More than that, one can see doubling and/or bifurcation all along the ribbons. This may be a new wrinkle on the behavior of "solar moss". Finally (but there are many lessons in these beautiful images) we confirm our initial suspicion - comparisons among all these image make it pretty clear that the ribbon motion has little to do directly with the local magnetic field intensity.
We need to quantify these morphological ("gee whiz") views, and put them into an MHD context. We believe that the coronal magnetic field is storing the flare energy, and releasing it via the physics of magnetic reconnection and associated coronal flows (largely invisible to TRACE, but sometimes glimpsed at higher temperatures by SXT; see an earlier science nugget describing this discovery). In principle we can use the geometry of the coronal field to understand its energy content, and its transformation during the flare, by calibrating it against the excellent SOHO magnetograms. Up until now this could only be described as a dream - the solution of the "flare problem", but it seems well within the grasp of these great new data. In the meanwhile, there must be a dozen features revealed well in these images, whose explanations would be steps towards understanding the dream.