|
|
The spectacular auroras seen all over the world during the magnetic storm of March 31, 2001 were dramatically visible in Southern California. This evoked a laconic statement from Bill Marquette, of Big Bear Solar Observatory, and an ebullient report from Greg Slater, of Lockheed Martin Palo Alto - the parent organization of the Yohkoh soft X-ray telescope, which provides most of our pretty pictures in these pages. All of this has led to a dramatic prediction in the inimitable style of Pat McIntosh - watch out for a much more powerful flare from the same region! Naturally, a phenomenon this rare deserves a Yohkoh science nugget, so here we are. Unfortunately, due to yet another application of Murphy's Law, the direct data on the solar event that produced this display are in transit, so we don't yet know exactly what Yohkoh saw. So this nugget will give background information, and then we'll tack on a postscript in a day or two.
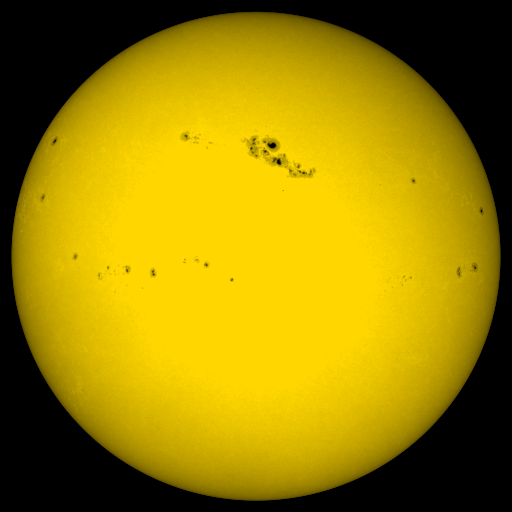
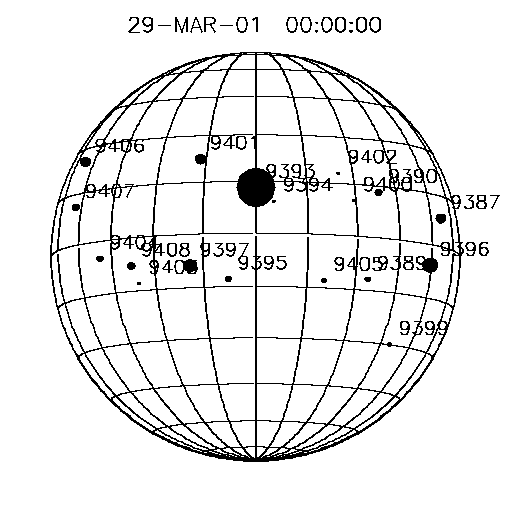
The solar activity at this minute is extraordinary, and it is dominated by an extraordinary active region:

|

|
The image on the left is an ordinary MDI white-light image, taken at roughly the time of the flare at the base of all this excitement. One can see a huge sunspot group. The plot on the right just shows the contemporaneous tabulation of NOAA active regions, with AR 9393 clearly the dominant member. The interesting thing here is the sheer number of tiny regions - many indeed, 18 at this time. The Sun appears to act globally at times like this, by mechanisms hidden to us within its interior - ie, solar activity is far from random in its occurrence.
Is this spot historically huge? Unfortunately not - the graph below show the biggest spot groups as a function of time over the past century. Our region had an area of 2240 units (millionths of the disk, so about 0.2% of the total projected area) and can be seen just at the right boundary of the plot:
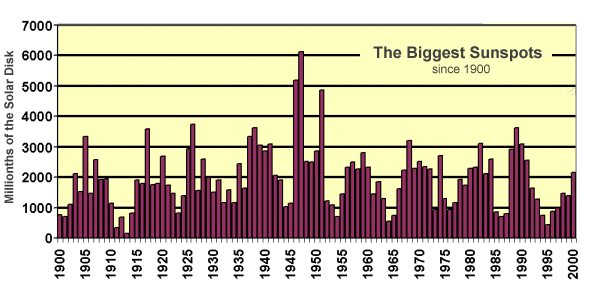
However, spot area only has a loose correlation with the magnitude of the flare or coronal mass ejection it can produce.
Of course Murphy's Law ([1] [2] [3]) comes into the picture when something nice like this happens. In fact the flare dodged all of the traps set by orbital mechanics and Prof. Van Allen:
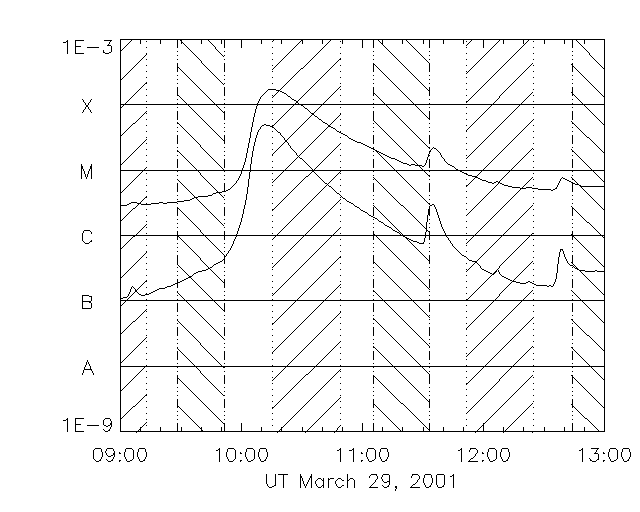
as this soft X-ray plot shows. The diagonal lines mark the times of orbit night and Van Allen radiation, respectively, when Yohkoh flies blind. We probably observed the most interesting phase of the flare, the onset, but - Murphy strikes back - we won't know until Tuesday because the data are still in the pipeline between North America and Japan somewhere.
In the meanwhile, we have this difference image between March 29, 13:22, and March 28, 18:56:
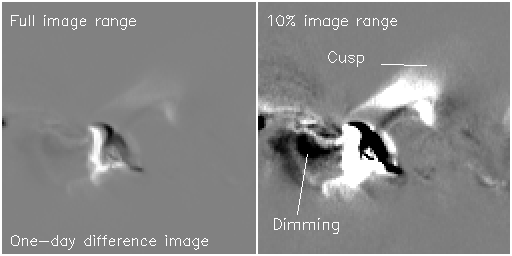
In fact, we've sometimes seen events similar to this. But it is just dawning on us that a powerful compact, impulsive solar flare can also lead to a strongly "geoeffective" coronal mass ejection (in fact, a picturebook example of flare geoeffectiveness!) Those blessed with good Internet bandwidth can see an earlier nugget on the somewhat similar X-class flares of November, 2000. This information is probably something new for the heliospheric community to think about. Since the flare represents the deepest and remotest visible counterpart of the general solar-terrestrial disturbance, since we cannot yet see inside the Sun, it probably deserves closer scrutiny.
Alas, no Yohkoh data! Signals crossed or an operations error resulted in the loss of one of the Yohkoh telemetry dumps to NASA's Goldstone tracking station. The data now litter the Mojave Desert. But... stay tuned... more and better flares are happening right now.
30 March 2001