HJC 2022/12/05 by Aki Takeda
0. Some backgound study
- Total Solar Eclipse (TSE) of 2019 July 2
1. Introduction
- historical stuff on coronal emission lines
- recent emission line observations at TSE :
means to study physical properties of the solar corona
-
ionic freeze-in distances
- average electron temperature
- sources of solar wind
- presence of various ionic speicies with spectrographs
- observation with coronagraph : limited in spatial extent
- from ground :
- from space : LASCO-C1
- purpose of this paper
2. Observations
Observation at Rodeo, Argentina, totality duration: 2 min 14 sec.
- high spatial-resolution broadbnad white-light image (Fig.1)
- RHT (Rolling Hough Transform) algorithm : a method of line tracing
devised by Clark et al (2014) for detecting interstellar magnetic field orientation in our Galaxy.
- excellent example of a solar mininum corona.
- no CME activity reported
(
DONKI).
- analyzed and reported in Boe et al.(2020),
- already calibrated into B⊙ units via MLSO
K-coronagraph.
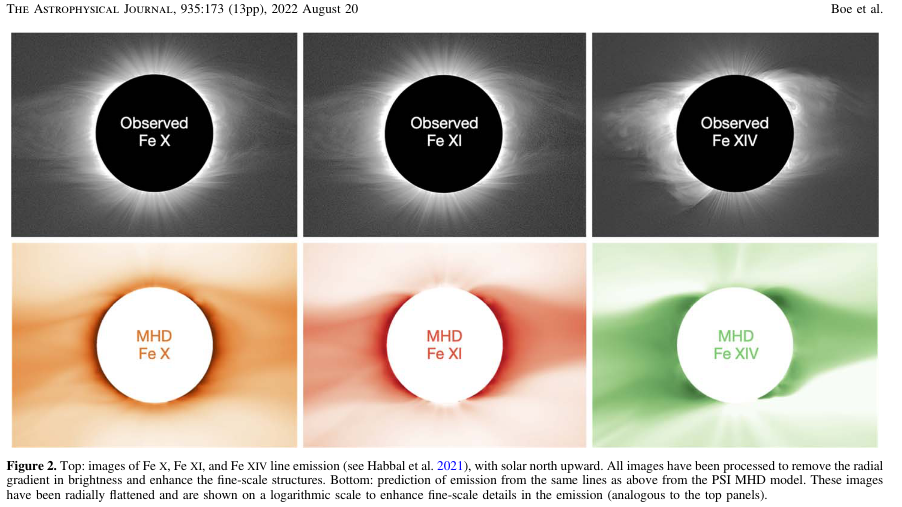
- line emission data with narrowband filter (~0.5nm) system (Fig.2)
- Fe X(637.4nm) Fe+9, Te~1.0MK
- FeXI(789.2nm) Fe+10, Te~1.2MK
- Fe XIV(530.3nm) Fe+13, Te~1.8MK
- on-band + off-band. (Fig.3)
2.1 Data Calibration
- Since the continuum data were already calibrated into B⊙
units, use off-band data (K+F components) to calibrate on-band data
(emission lines).
- Additional correction regarding line width (subsec. 2.2)
--> correction factor (Fig.5)
3. Eclipse Observables
3.1 Absolute brightness of Fe X, XI and XIV
The first to quantify the absolute brightness of these optical emission
lines beyond ~1.7 R⊙.
- FeXI is the brightest of the three emission lines, retains high S/N
until 3.4 R⊙. Roughly correlates with K-corona, but steaper radial
intensity drop then K-corona.
- FeX less radial gradient than FeXI, fade at ~3.0 R⊙.
- FeXIV shows file-scale variation throughout the streamers. Strong at
the core of streamers but fades very quickly at greater elongations.
3.2 Electron temperature
Method to device Te from line ratio (cf. Boe et al (2020) ApJ 888 100) :
line ratio(relative to B⊙) modified with atomic data(Table 9)
--> ionic density ratio ---> Te (Chianti DB, Fig 4)
- FeXI is the most abundant ion throughout the corona even in high-Te region.
- Te values derived from FeXIV/FeXI and FeXIV/FeX are consistent.
- 1.25-1.4MK for CH
- 1.5-1.65MK for streamers
- Te from FeXI/FeX is quite different from the above.
4. The PSI MHD Model
PSI magnetohydrodynamic model prediction
4.1 Formard Modeled Line Emission
- Forward-modeld K-corona emission was found to accurately predict the
brightness of the K-corona.
- Expand the comparison to the emission line corona :
- local thermodynamic equilibrium
- consider radiation field neear the line center originating from both
radiative and collisional excitation.
- Chianti 10 DB and software package
- 'hybrid' coronal elemental abundances
- calculate 3D structure and flatten (LOS-integrate) to compare
with eclipse observations.
4.2 Testing the model
- Line emission compariton
- FeX prediction is the best
- FeXI also good but underestimate CH emission
- FeXIV complicated.
- Te compariton
- model Te are slightly lower on average.
5. Conclusions
--- go to summary in the paper ---
Points of my concern


