Weeks 5 and 6 were shorter weeks as we had a long weekend for the fourth of July, and consisted of magnetic field extrapolation attempts. Using the HMI magnetogram time plot created in weeks 3 and 4, we ran magnetic extrapolation code in order to see the relative location of the flare loops and the polarity differences. It took me some time to understand what was going on and how exactly the code worked, but I ended up getting some of it. At the end of the week 6 I gave my midterm presentation for the department.
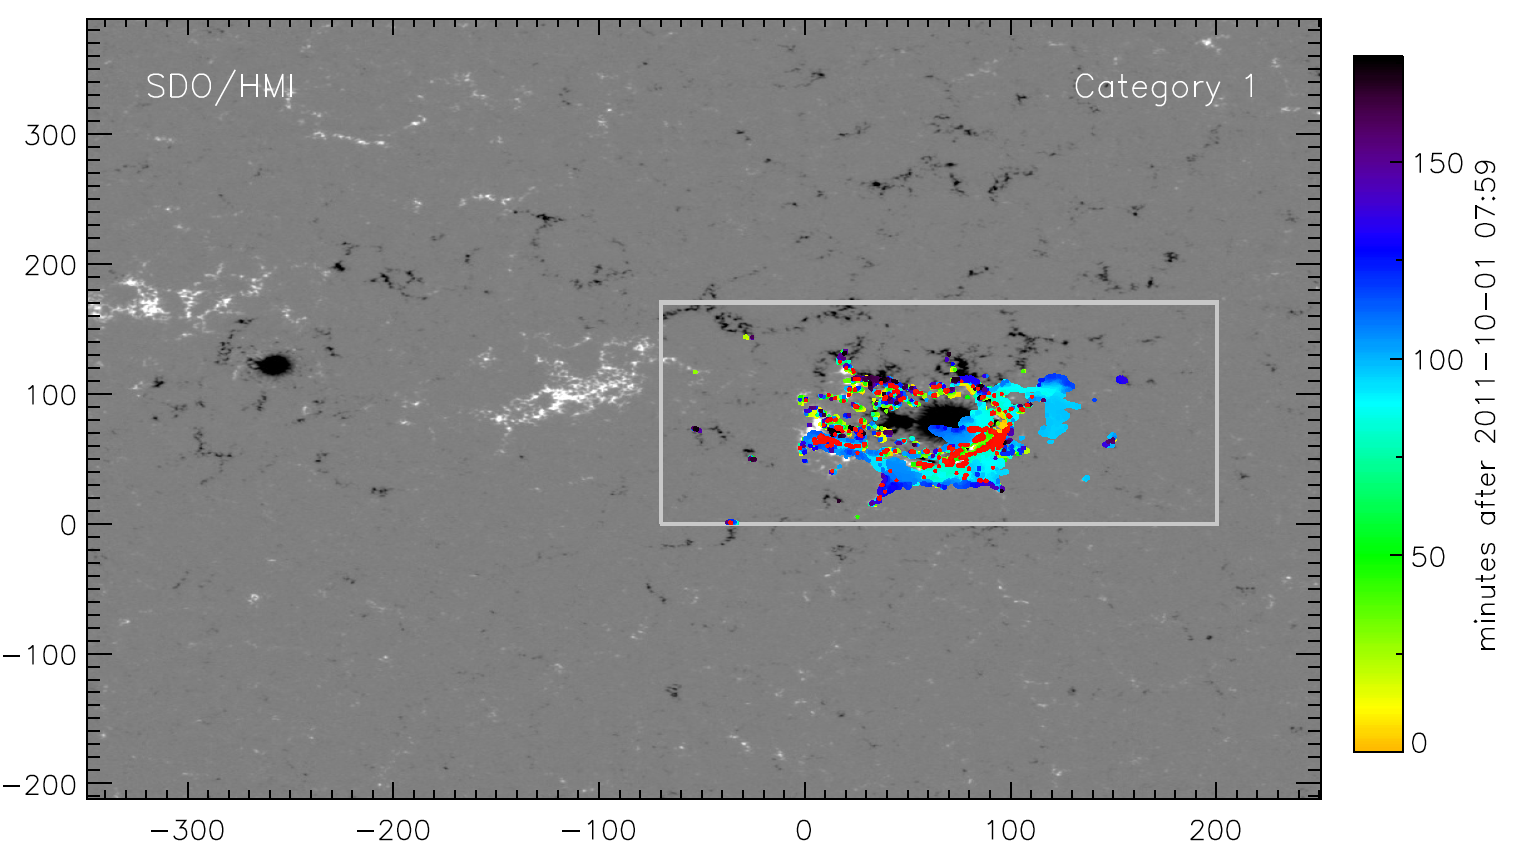
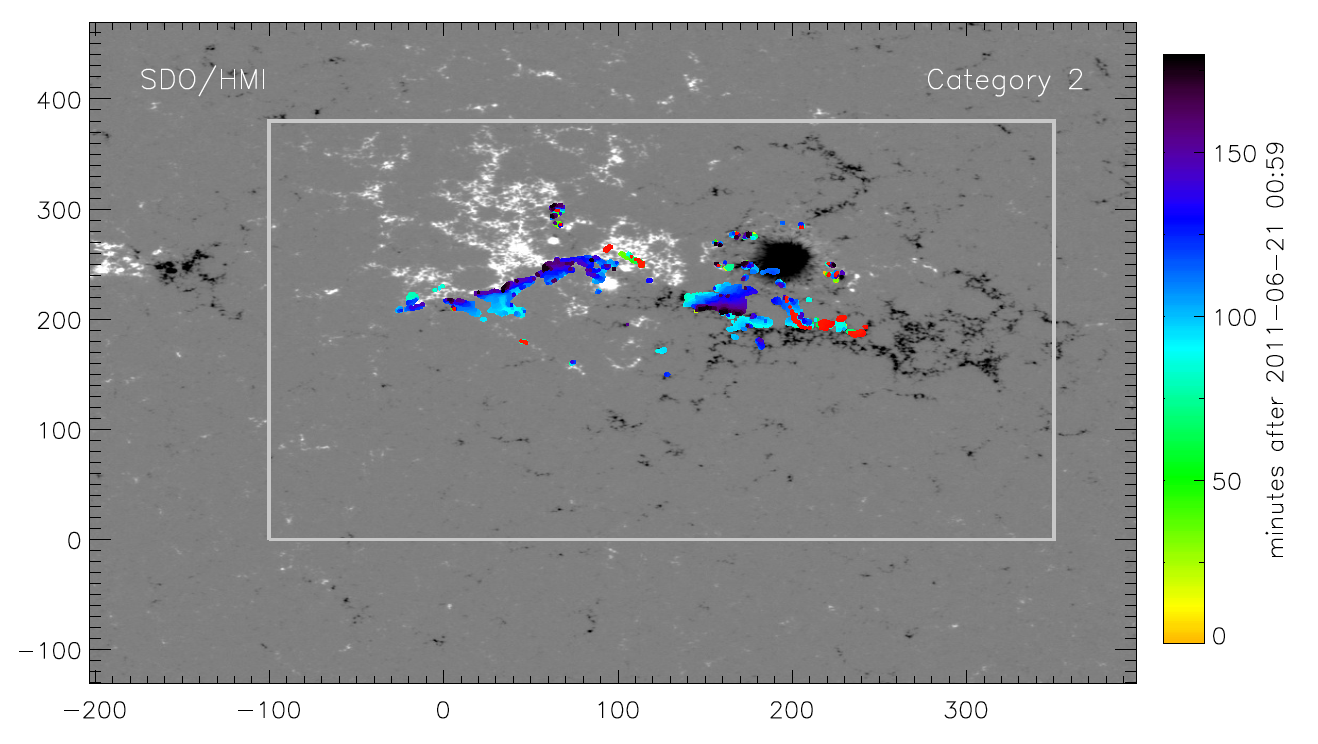
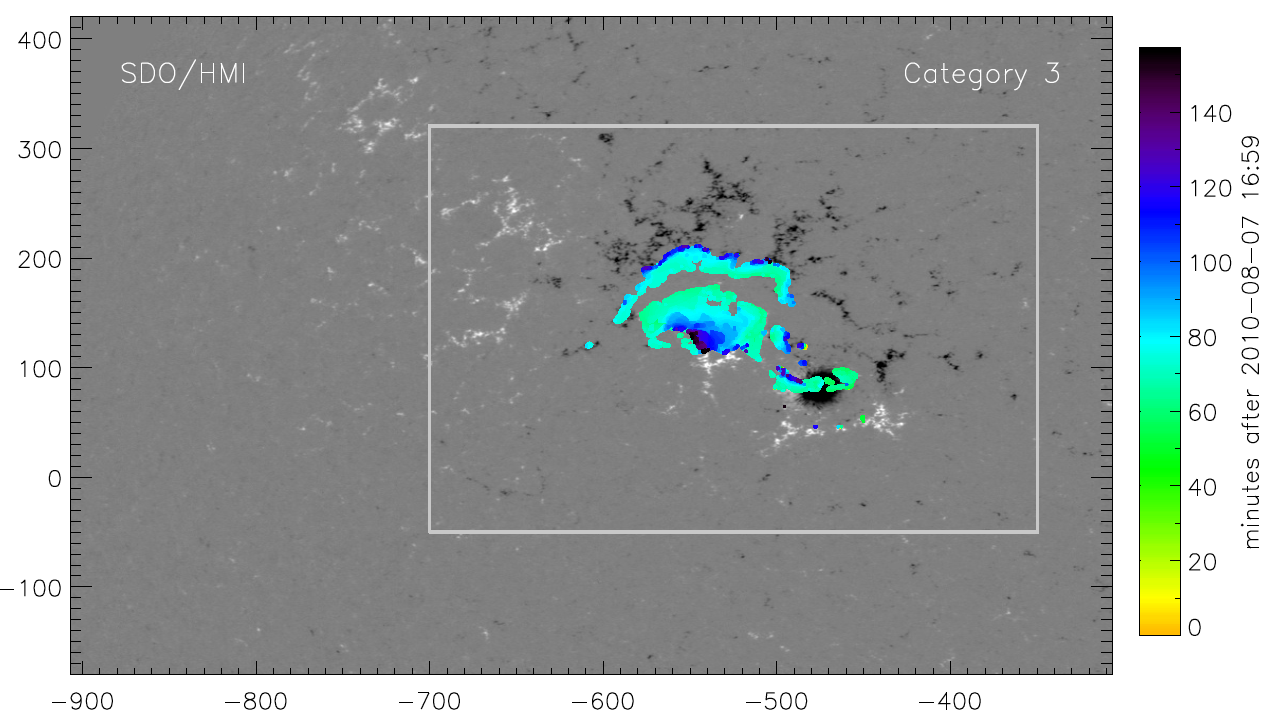
Below are time plots on magnetograms for all three events, 10/01/2011, 06/21/2011, and 08/07/2010. The early bursts are shown in red pixels, whereas the rest of the flare is plotted in different colors according to time.


My midterm presentation can be found below!