Introduction to the Sun-Earth Relationship
Do two guns really produce two different bullets?
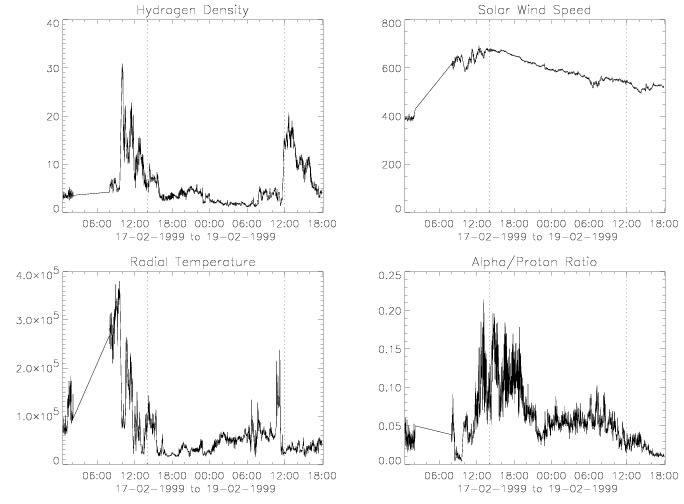
Using Cane and Richardson's start and end times for magnetic clouds as a guide, we downloaded data from CDAWeb from 16 hours before the cloud began at 1 AU through six hours after it ended. This data was then run through the program findavg in order to obtain the average hydrogen density, solar wind speed, radial temperature, alpha/proton ratio, sheath speed and sheath temperature. The program also outputs four graphs, plotting the density, wind speed, temperature and ratio versus time and marking the start and end times of the cloud, as you see here.

You can see the depression in density, alpha/proton ratio and temperature as well as a constant decrease in solar wind speed inside the magnetic cloud. You can also see the jump in density, wind speed, temperature and ratio just before the cloud begins. These are signature characteristics of the sheath.
