Week 1 Week 2 Week 3 Week 4 Week 5
Week 6 Week 7 Week 8 Week 9 Week 10
2nd June 2010 This is will be the first entry in my weblog which hopefully I'll manage to keep updated along the way the summer.... So, down to business then....The first couple of days this week were orientation stuff, and meeting the other REUs and people in the department. We're also getting some IDL and UNIX lessons from Chris which has been really useful. Today I spoke to my supervisor (Jiong Qiu) about the IDL assignment I have to present on Friday. I have to take some data from a solar flare and plot a light curve of the region, then a second light curve of just the flaring region (which Jiong says to make ~ 10 times the median values. Then, I've to take a magnetogram and work out the magnetic flux and from that the reconnection rate. ....I managed to get one light curve working, but the second really doesn't look right. Chris suggested putting a 'stop' into the program which means I can look at the variables as they are when I stop the program. I did this, and the median values are negative, which would explain the wonky light curve. I'm not sure why they're negative yet: |
Negative
Median Values??
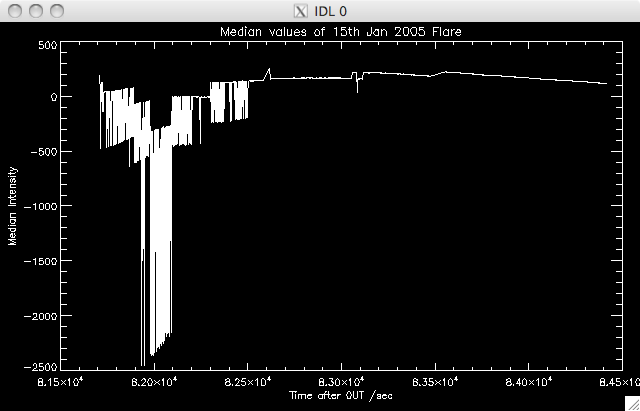 |
....After asking Chris (I think Chris will regret volunteering himself to help us with IDL over the summer) he doesn't see a problem with my code so I went and showed Jiong what I had. She said that this can happen sometimes because of dark current corrections in the data...right now I've just to take the flaring material to be greater than 10 times 100....and we'll fix the data next week. |
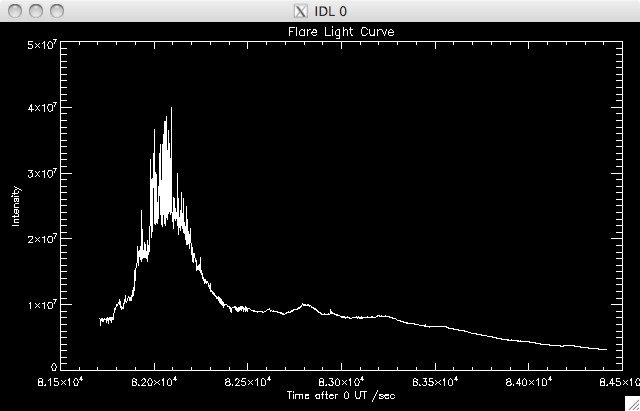
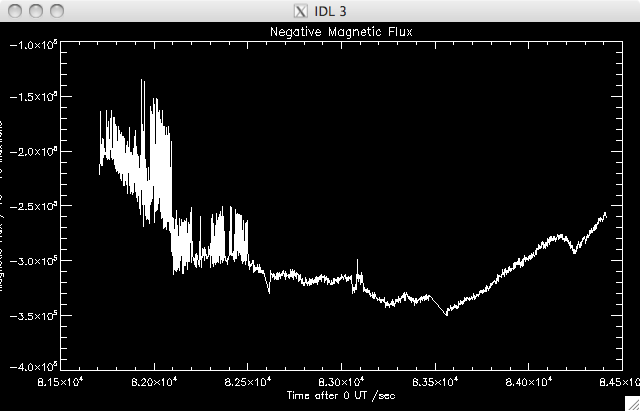
3rd June 2010 Second day of the IDL week....I was working on the magnetic flux part today. I tried using the where function in IDL to find which pixels in the flare where brightened. I would then take the same pixels from the magnetogram and measure the flux. Flux = BA and I could roughly estimate the area of region by working out how many pixels, and the area of each pixel- quite crude, but thats all I need for the assignment....Jiong says I'll do a more thorough job next week in the proper research. ....however, the where function in IDL is a bit weird as it doesn't give you the ith and jth indices, it gives you a stream of numbers which somehow can be decrypted into indices....I'll figure out how to do that properly later....in the meantime I'll instead make a simple boolean mask and multiply it by the magnetogram data. .....that seemed to work, and so to get the flux I separated the magnetogram into positive and negative regions and summed up the magnetic field in each region. I added these to arrays and multiplied by the total area to get flux. ......I then did a quick back of the envelope calculation to make sure the reconnection rate was in the correct range (i.e. 1x10^18-19 Mx/s) by diving the time taken for the flux to rise by a certain amount by the increase in flux (so flux/time)...again, this was quite crude, but the intention this week is to get IDL working properly. I got the following plots: |
 |
 |
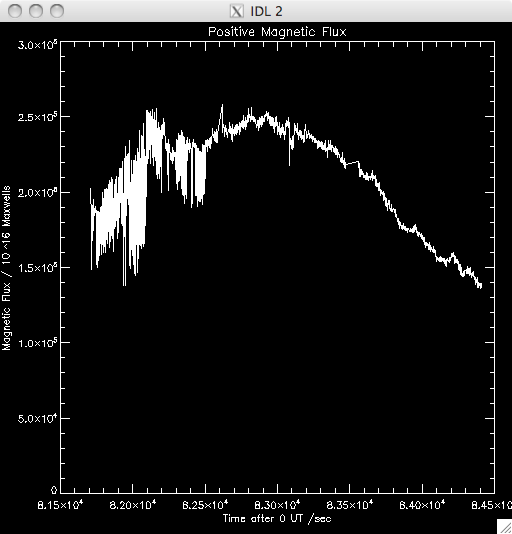 |
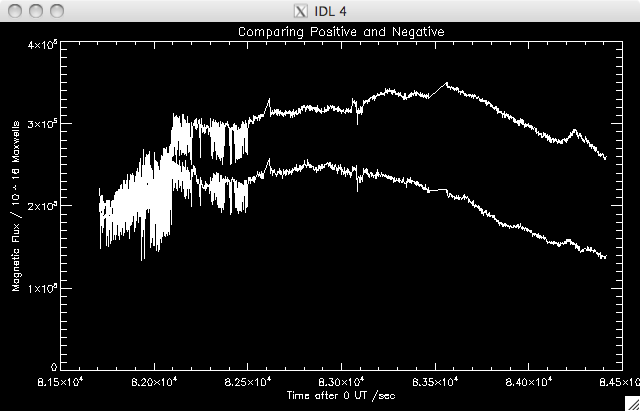 |
4th June 2010 This morning I quickly did the last part of the project to identify where the pixels were newly brightened. To do this I just chose two time frames about five minutes apart, and subtracted the two images, to leave only the new pixels. These are the two plots I obtained: |
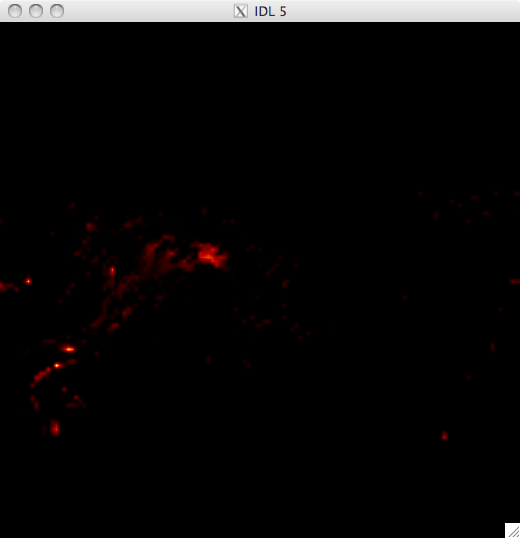 |
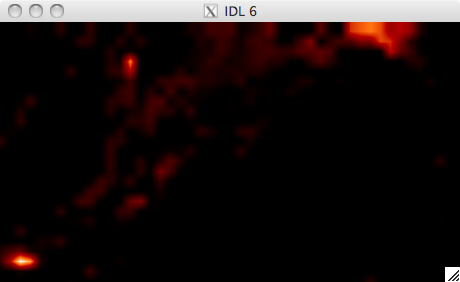 |
We then had the group meeting where we presented the assignments we had been working on. In the afternoon I spoke to Jiong about what my project would be over the summer: I will be studying the 15th Jan 2005 Flare, the same one I've been working with this week, but I'll be working with higher resolution data. This is an example of a two ribbon flare, and the question Jiong wants to address is why we see ribbons in UV but not in HXR....she has a theory which we will hopefully be able to test by analysing this flare's reconnection properties in the UV and comparing them to some HXR analysis performed by Jiong's postdoc Dr Cheng. |