Week 1 Week 2 Week 3 Week 4 Week 5
Week 6 Week 7 Week 8 Week 9 Week 10
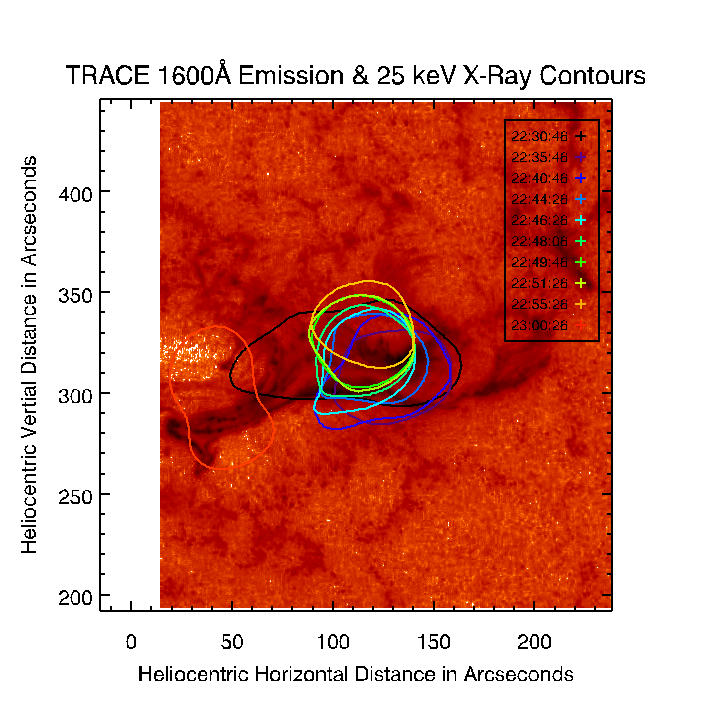
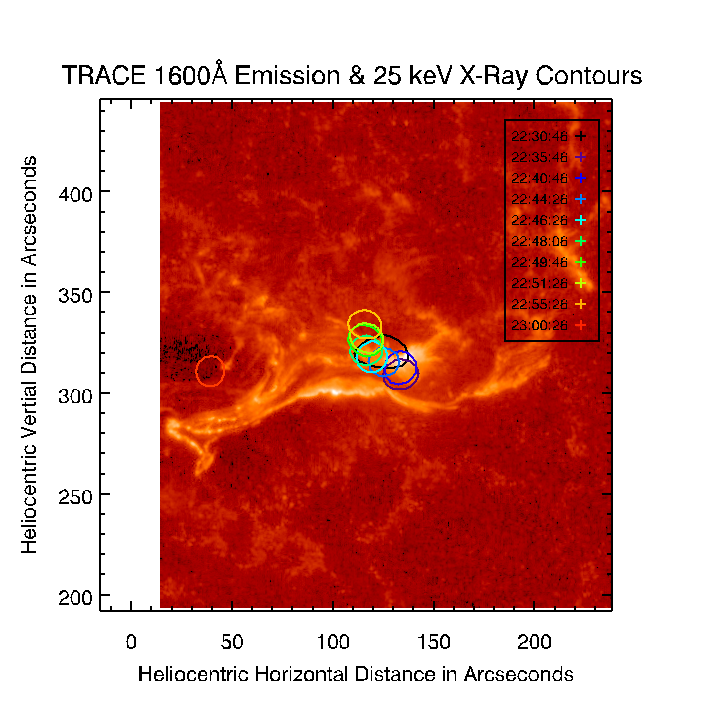
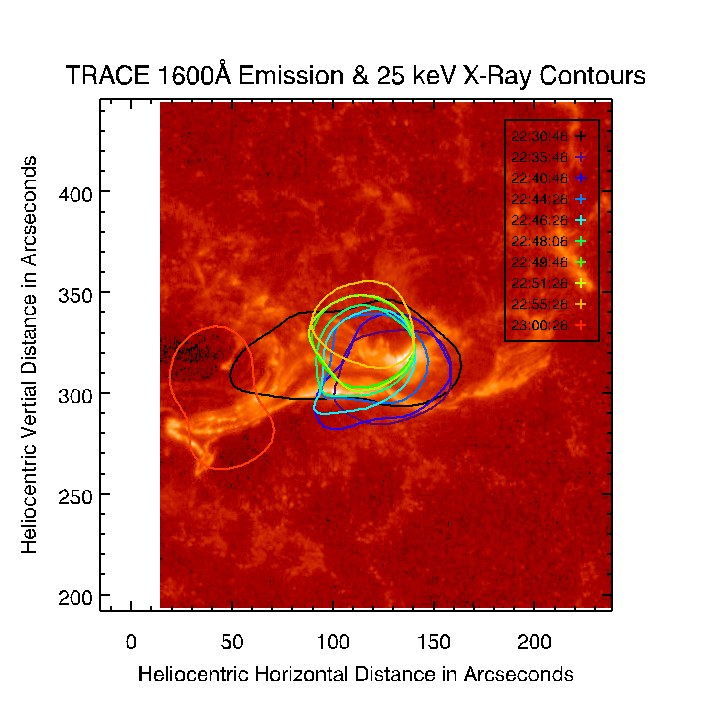
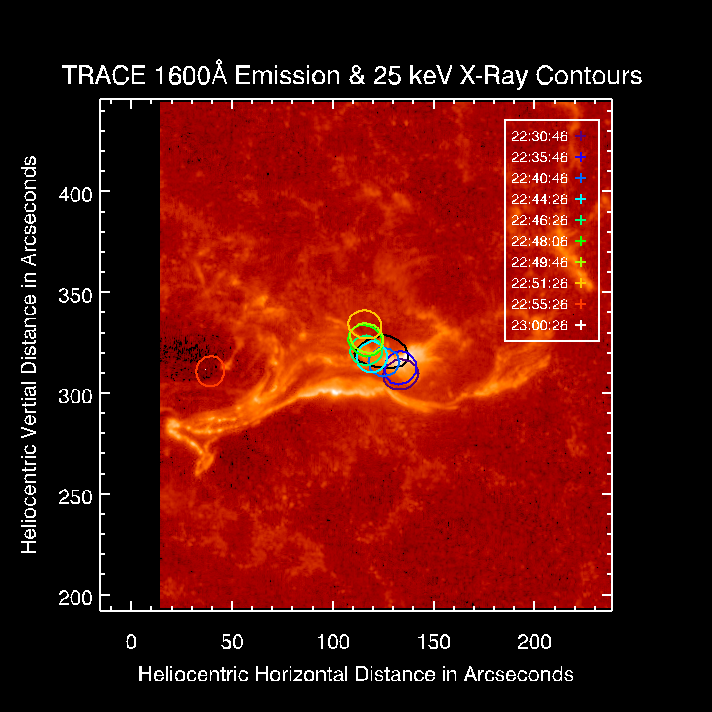
| 26th July 2010 This week is mainly going to be tying up loose ends and writing my presentation as I have all of my programs written and main results in. At the end of last week I was trying to plot an exponential to the second region of UV decay but could not get any meaningful results from this. The only way to get any reasonable fits was to remove the constraints and even then I only managed to fit 50 from 9900 pixels. My conclusion from this is that, although there does appear to be a second region to the decay of the UV sources, it is too simplistic to say that it is an exponential. Even from looking at the majority of light curves, the second region can be seen to be more complex than an exponential. This does not change my overall results as the goal here was to show that the UV decays over a relatively long timescale, which is clear from the light curves, and first region results. Future work on this may yield a general relationship (and cause) of the decay profiles, or allow the UV sources to be identified (i.e. discrete sources not continuous ribbons) but for the purposes of this project, I have what I need. The only two things that remain are to coalign the HXR images with the TRACE and SOHO MDI images so that I am able to plot the HXR footpoint motion as contours, to demonstrate that they move along with the UV ribbons, and to try some RHESSI spectral analysis to try and find the temperature profile, spectral index and emission measure in the early phase of the flare. Coaligning the images was very similar to before, except that I need to compare arcseconds first and then convert to pixels depending on what reference image I wish to align to as the pixel resolution differs between RHESSI and TRACE/MDI (2'' per pixel in RHESSI compared to 0.5'' in TRACE & MDI). I used the following equations where i and j refer to the coordinates of the lower left corner in heliocentric arcseconds. I then multiply by 1/(pixel resolution) to get these coordinates in pixels on the images (i.e. for TRACE/MDI I multiply i'' x 1/(0.5'' per pixel) to get i pixels.) To coalign RHESSI and MDI: If Xr = Xcentre of RHESSI image, Yr = Ycentre of RHESSI image, Lr = length of RHESSI image Xm = Xcentre of MDI image, Ym = Ycentre of MDI image, Lm = length of MDI image i'' = [(Xr-(Lr/2*2)) - (Xm
- (Lm/2*0.5))]
j'' = [(Yr-(Lr/2*2)) - (Ym - (Lm/2*0.5))] The procedure for TRACE is
the same, just replace MDI values with TRACE values.
I have been having trouble with using the RHESSI gui all day. After solving a couple of problems (like the data not being downloaded to where it should be stored) we realised that my IDL startup was missing some pathways and so Keiji fixed everything up for me and I had time to quickly run through the RHESSI spectrum process and so I'll do the OSPEX fitting tomorrow. |
27th July 2010 I managed to pick up the OSPEX gui and procedures pretty quickly (well, the process at least not the intricacies or details) and so got some initial results of the spectral analysis. I had a bit of trouble plotting them but Angela pointed me in the right direction and so Jiong and I got to look at the temperature and spectral index in the early phase of the flare. The results are pretty rough as, although the data is fit well in the non-thermal region it is not so good in the thermal region which is where we are interested. Last week we roughly demonstrated that the perp reconn rate goes with non-thermal emission (i.e. this pattern of reconnection is more efficient at producing non-thermal emission than parallel) and so we were interested in the parallel reonn rate and what the spectral analysis would show near the peak of parallel reconn rate. It seems as though there is a thermal emission peak preceding the peak of the flare and the the non-thermal region, and this is present in the area of the parallel reconn rate peak. There are issues still to fix, such as attenuator changes causing large chi-squared values in some areas, but if this is correct then it suggests that the parallel reconn rate may be more efficient in producing thermal emission. We also ruled out the thermal emission potentially being caused by a smaller flare 30 minutes before (which can be seen in a GOES temp plot) as RHESSI picks this up and the readings seem to return to the background before the thermal emission begins. Unfortunately the RHESSI spectroscopy site was down all afternoon (and evening) and so I cannot access the procedures for how to deal with attenuator changes (I need to know how to create two SRM files, one for each attenuator). Hopefully this will be up and running tomorrow, as I want to finalise everything soon. |
28th July 2010 I spoke to Angela about the RHESSI spectral analysis and she said that the attenuator changes were accounted for by the software, and that the errors are maybe because I'm using the broken power law fit as opposed to a thick-target bremsstrahlung fit. I ran the programs again, and the results do have a better fit, but its still not perfect, and the error bars on the temperature plot were ridiculous. As well as doing that I have been creating some postscript plots for my presentation and started documenting my directory so that its clear what the save files contain, and what the programs do. |
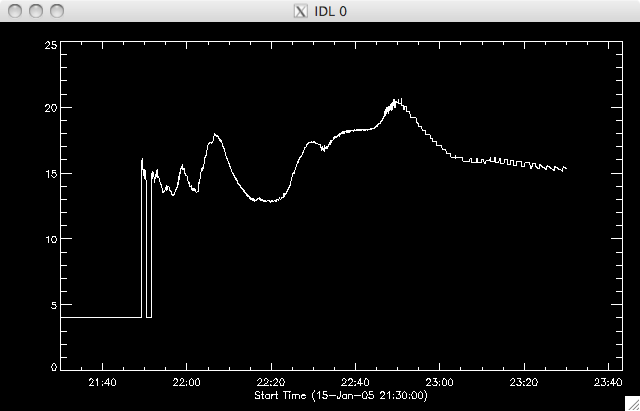
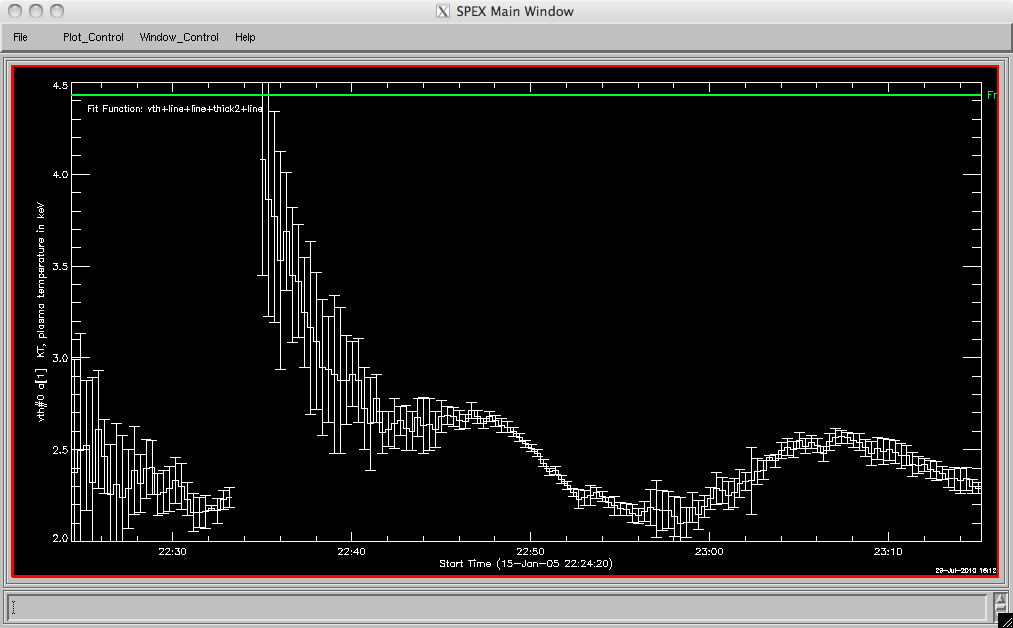
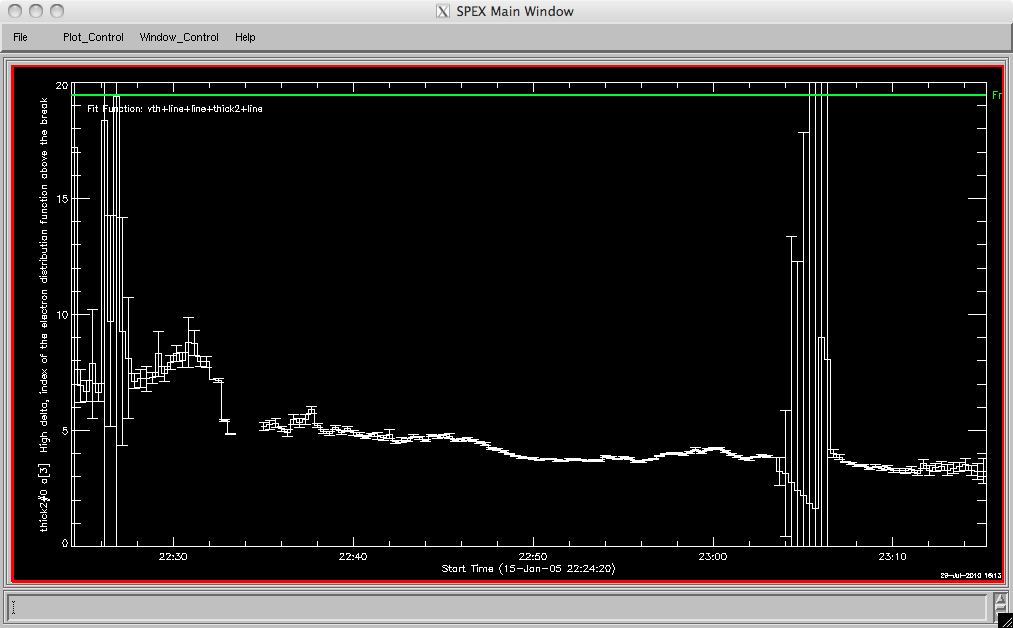
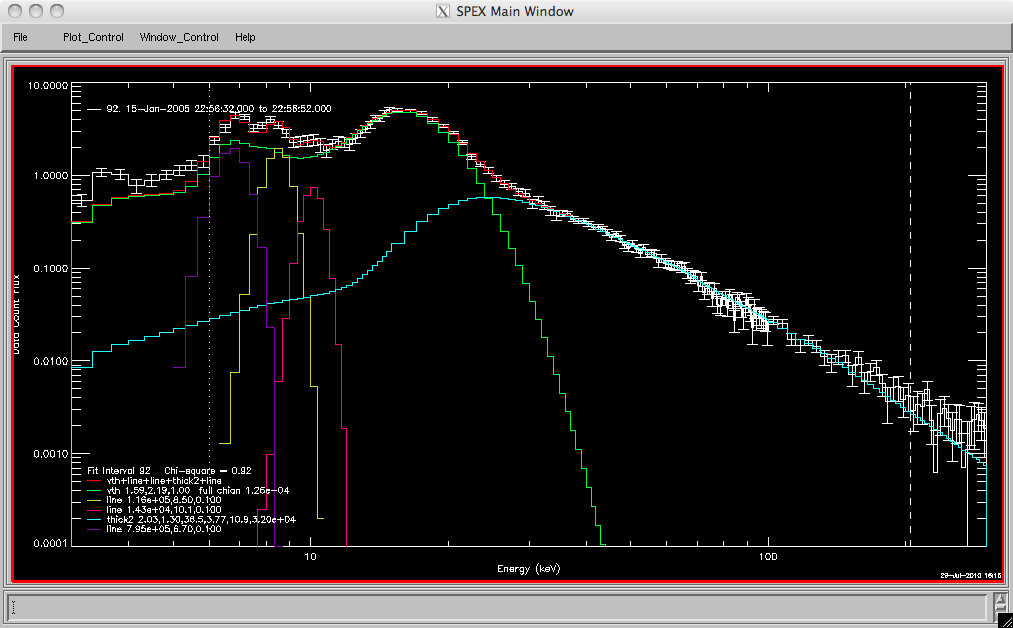
29th July 2010 I ran the spectral analysis once more. This time I split up the intervals so that I had one set of intervals before the attenuator change, and one after. I also changed the energy range to only investigate the spectra after 6 keV as Angela said theres a problem associated with studying below 6 keV. Finally, I used different line guassians to perform the fit. Originally I had one at 6.7 keV, and one at 8 keV. It turns out that these are now accounted for the variable thermal fit, but some instrumental effects at 8.5 keV and 10.1 keV are not and so I moved the guassians to these energies. The results were much better, with good fits after about 22.38 and before 22.27. The temperature is still unusually large (~45MK) and there are a large error bars here. This is also the range where the data takes a weird dip which the fit doesn't follow. Because of this we are not going to look into this range and so we can't really comment on the efficiency of thermal emission with reconnection rates without more information (the peak of the thermal is in the area I didn't cover due to the attenuator change). GOESS shows a rise to a peak in the area we would expect, but at a much lower temperature of 25MK (which is still large). The emission measure suggests that only a small proportion of the plasma is being heated to these very high temperatures. The spectral index on the other hand does have good, clean data. We can clearly see a decrease to a flatter plot when the HXR emission begins to peak with the perp reconn rate, which confirms our conclusion that the perpendicular rate is more efficient than the parallel rate at non-thermal emission. The overall conclusion here is that the pattern of reconnection does have an impact on the energetics. |
GOES
Temp plot
 |
RHESSI
Temp Plot
 |
Spectral
Index
 |
A
Typical Fit
 |
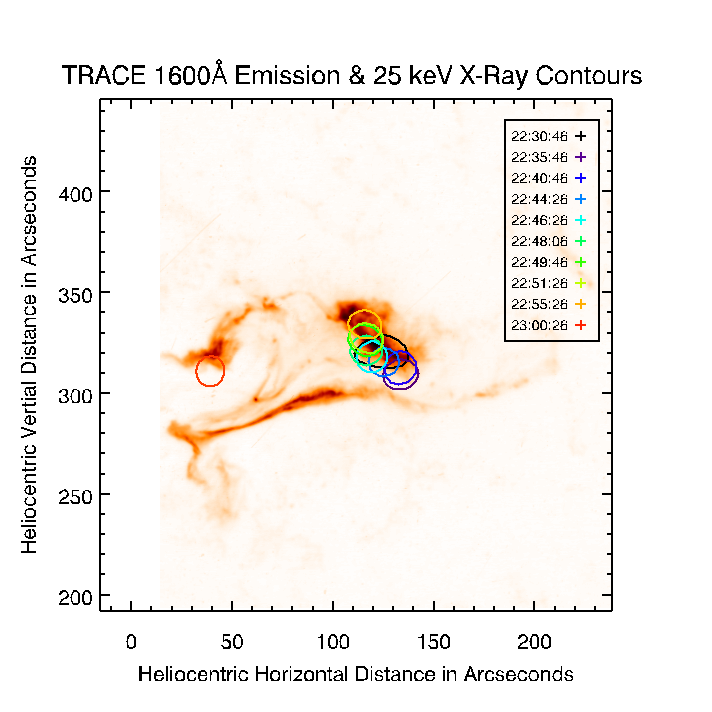
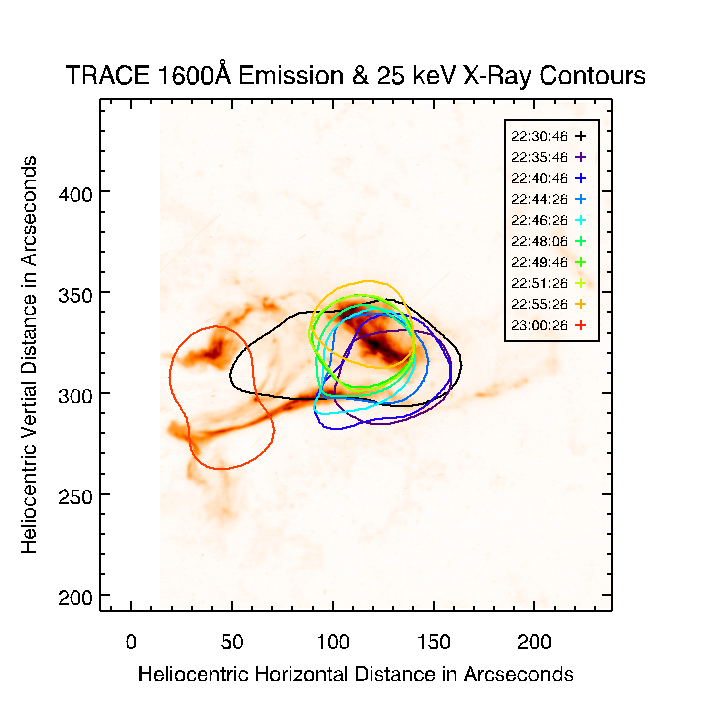
30th July 2010 Today I wrote a bunch of programs to produce some plots of my final results, with different options. Here are some of the variations as I want to compare them all together: 90% (left) & 40% (right) contours
showing kernels as opposed to ribbons:
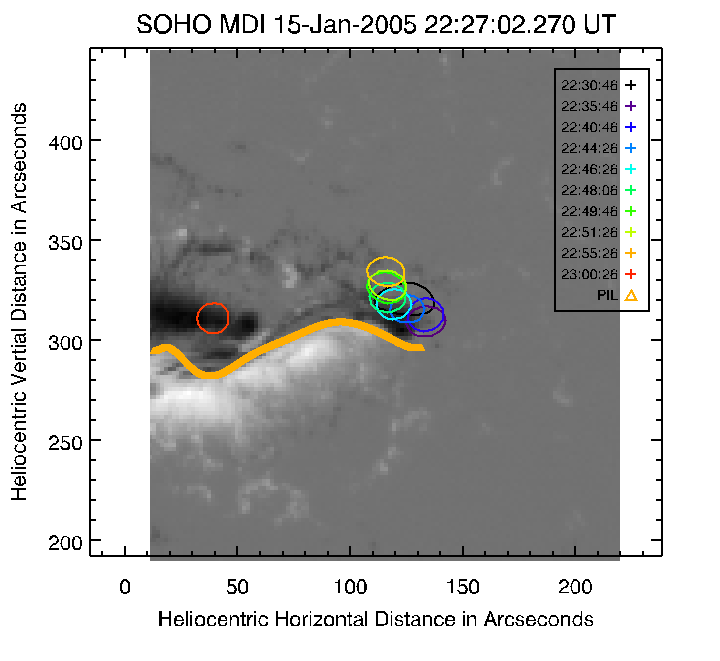
  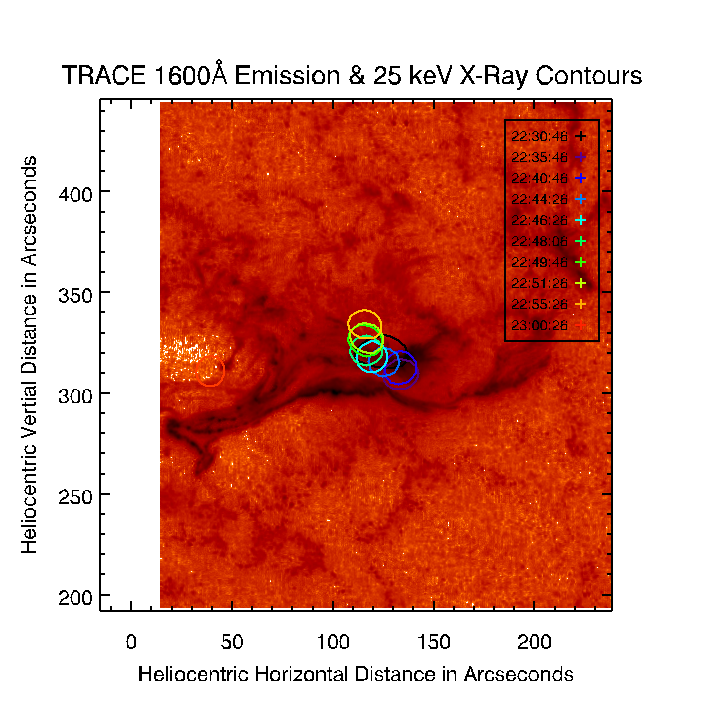     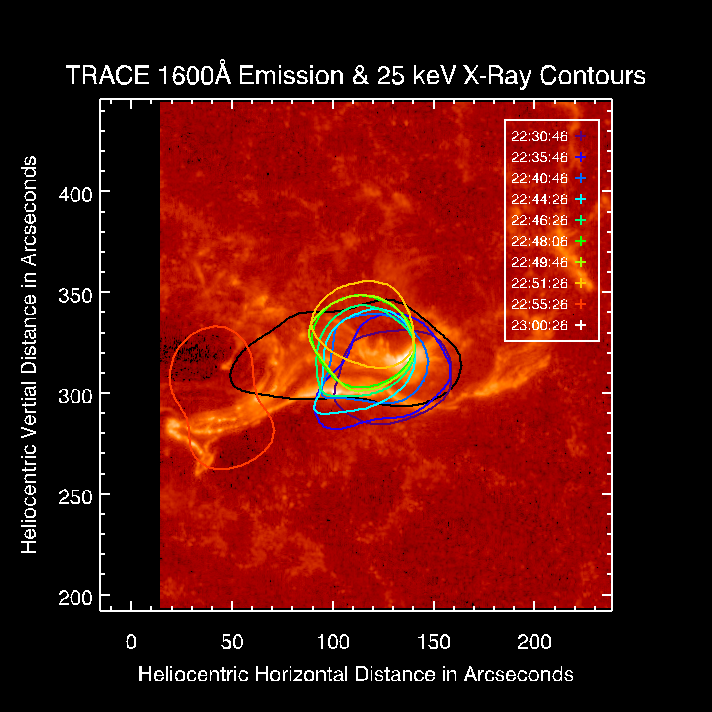 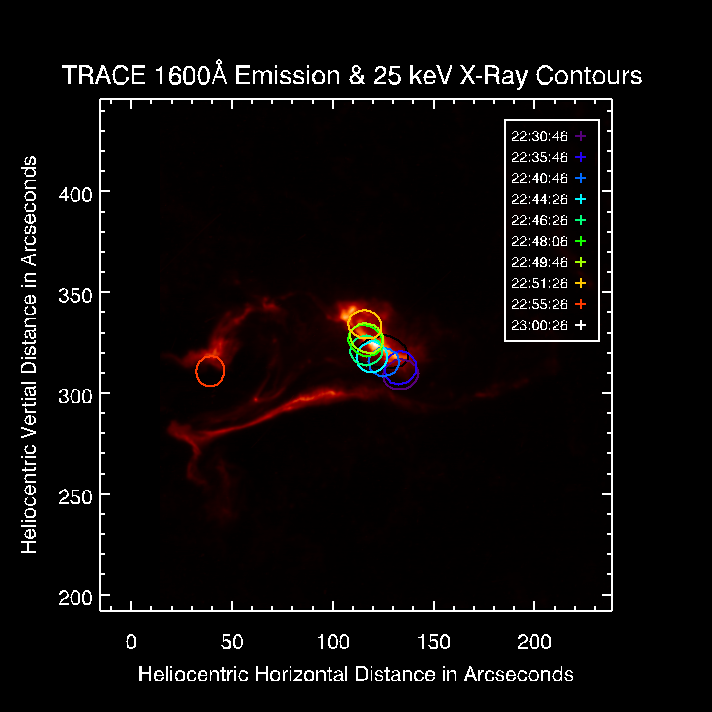 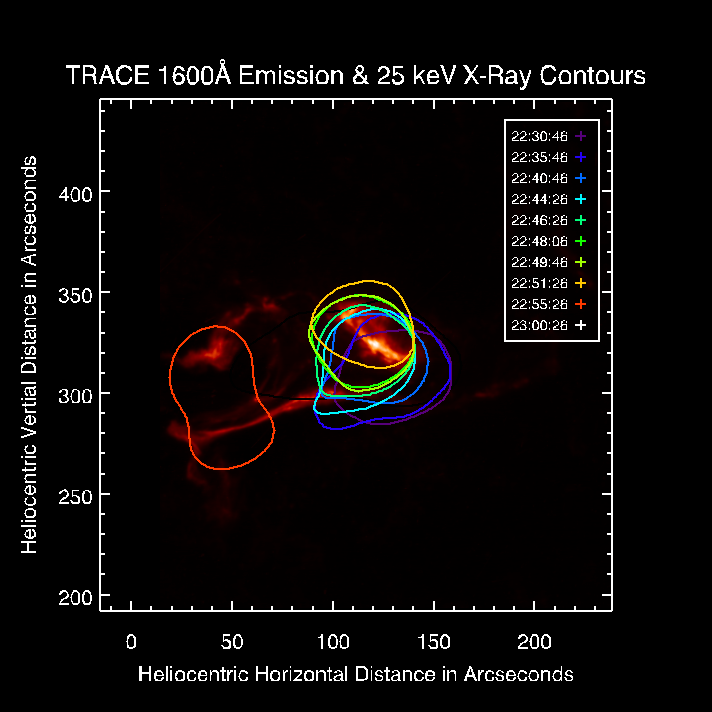 Same thing fot the MDIs
90%, 60% & 40% HXR contour levels
 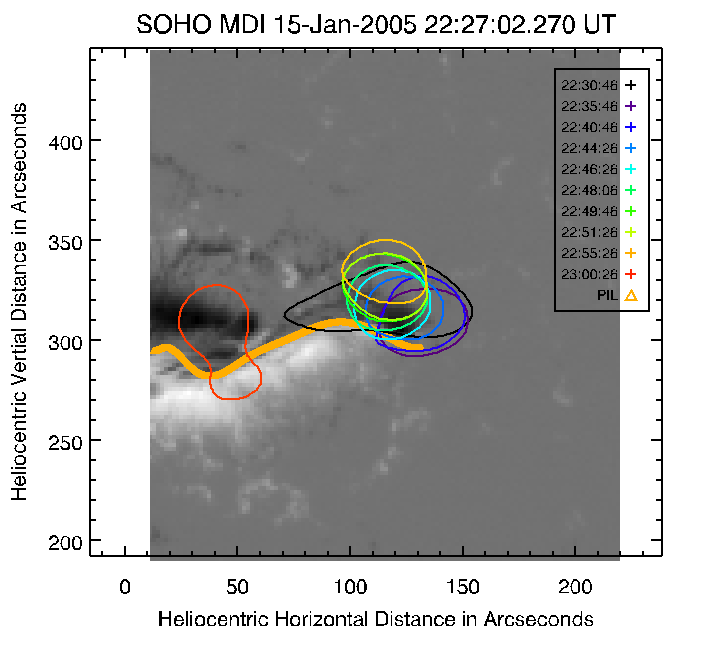 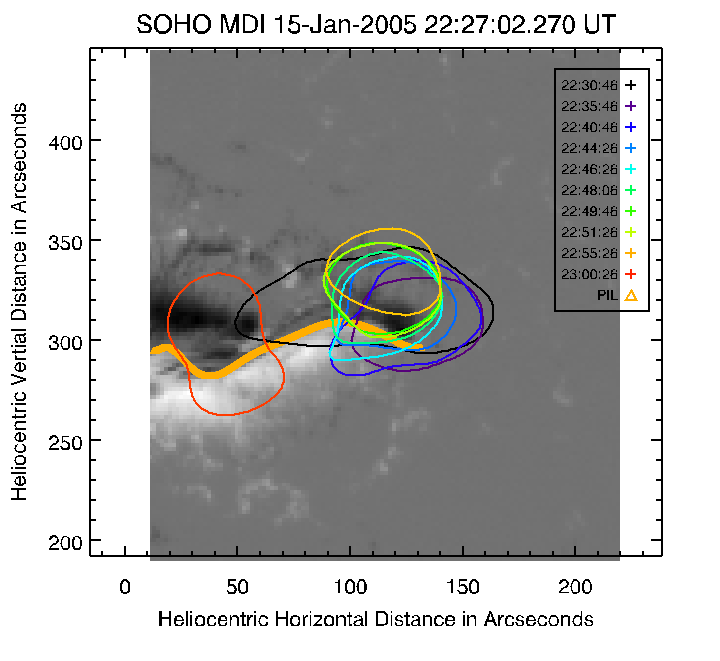 |